
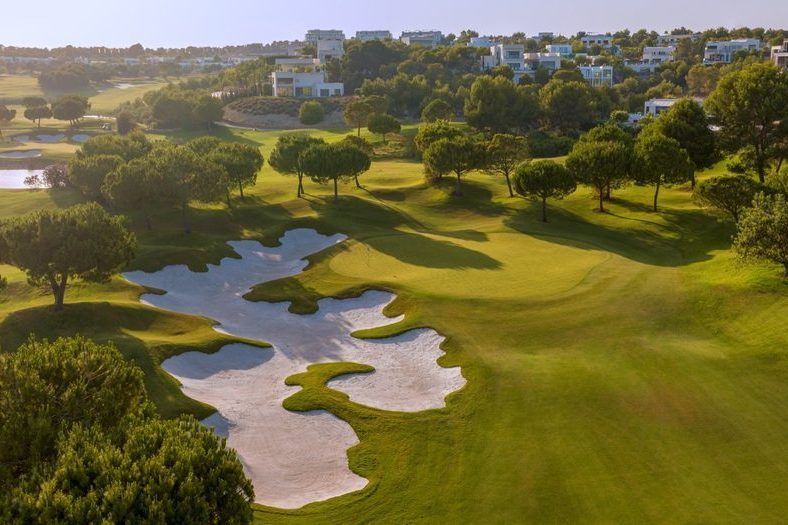
What the numbers tell you, and what they do not.
Over dinner someone mentions what a neighbour's house sold for. Or you open the paper in the morning and the headline has a percentage in it. Either way a number lands on your table, and you start doing the sums. What does it mean, and will it go on?
You may remember a friend who bought years ago and now mentions it a little more often than before. A percentage in a headline has a way of turning into a story about you, and it is worth slowing down before you write that story.
Those are fair questions, and the figures are worth knowing. They are also easy to read too quickly. Here is how I read them.
The market moves
Property prices follow the market. In the short term there are ups and downs, and prices can move in either direction. In the long term, in my view, property has been one of the most solid ways to hold wealth. There are no guarantees, and no one can promise how prices will move.
Tinsa's report for the third quarter of 2026 shows the value per square metre of homes in Alicante province 18.1% higher than a year earlier. That is a clear number, and it describes what has already happened. It is a good fact to hold in your mind, and it is also a fact about the past.
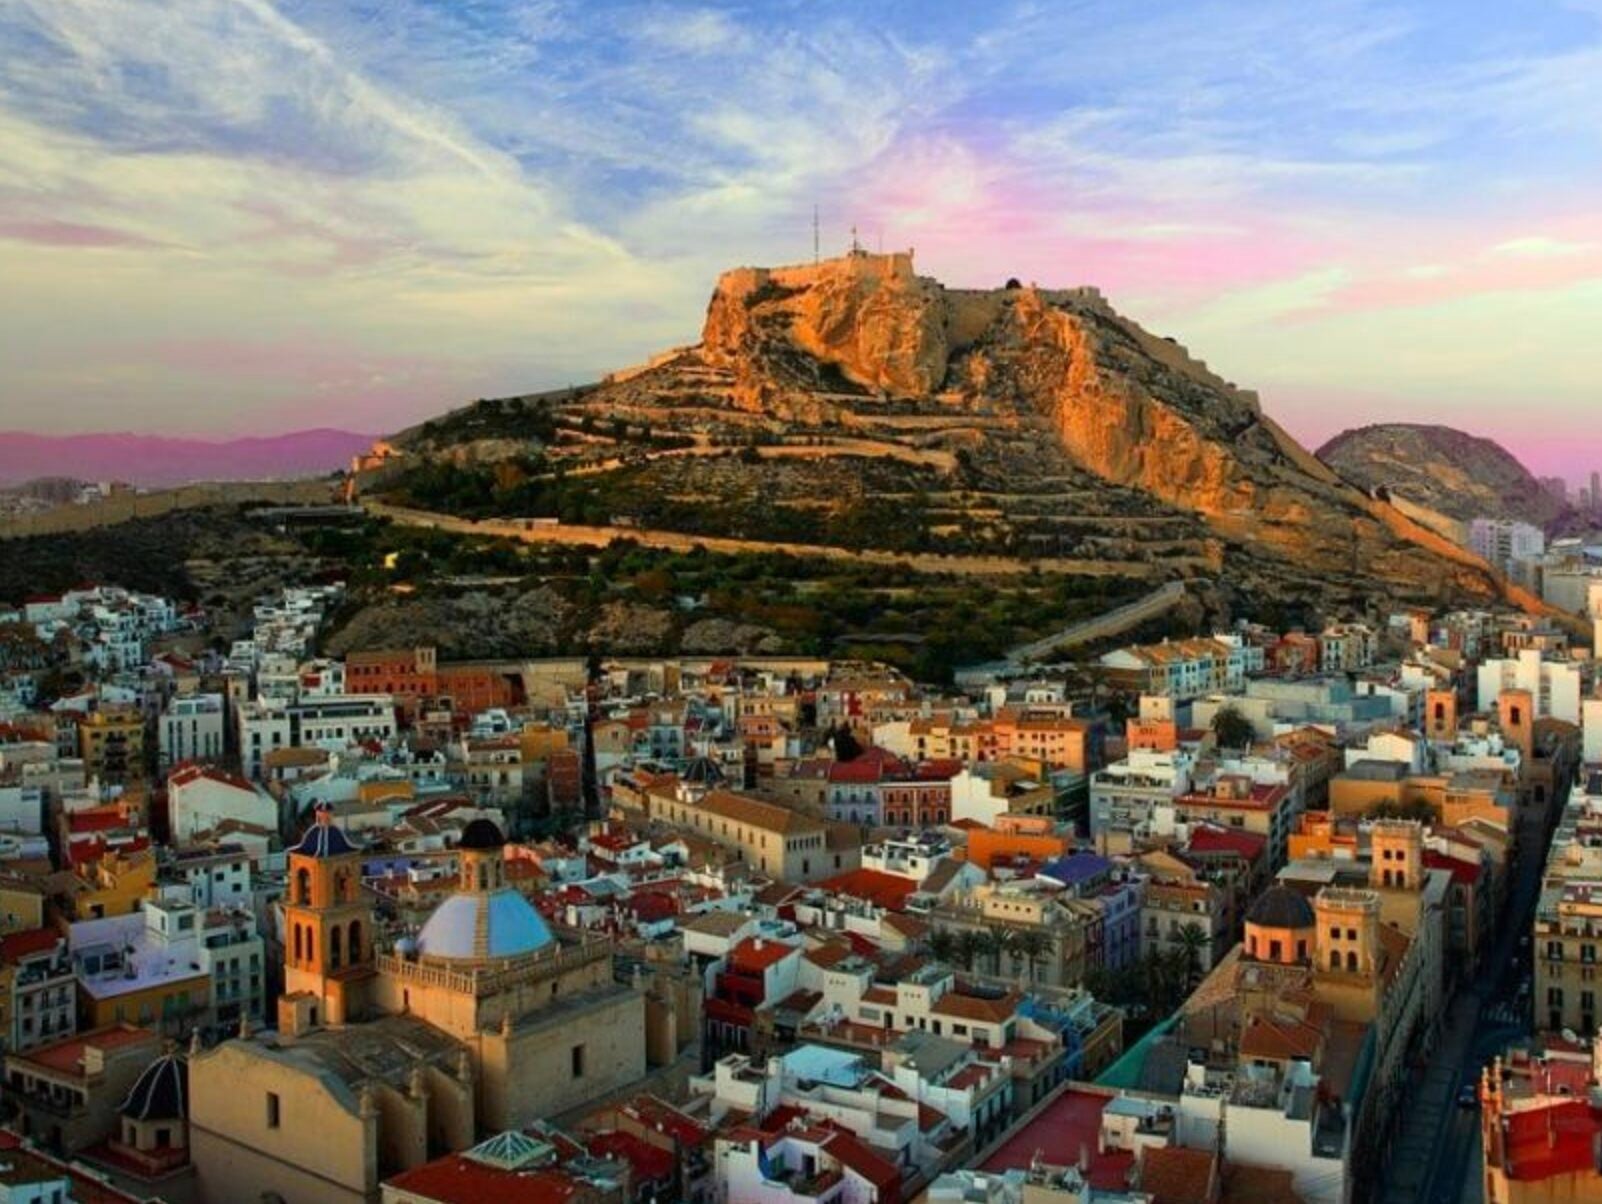
The economy behind the market
Behind the market is the economy.
The European Commission's spring 2026 forecast expects the Spanish economy to grow 2.4% in 2026 and 1.9% in 2027, after 2.8% in 2025. Those are the Commission's own figures, and they are a forecast. They show growth in each of the years, easing gradually from one year to the next.
A price figure shows where the market has been. A forecast shows where the economy behind it is expected to go. Read side by side, they give more of the picture than either does alone.
What to do with the number
The next time a percentage lands on your table, you can do three things with it. Put it beside your own timeline and ask when you would like to use a home. Ask what you want from the home itself: the location, the size, the way you want to live. And note which part of the figure is fact, which part is forecast, and which part is still unknown.
The Tinsa figure is a measurement of the past. The Commission's figures are a forecast. Where prices go from here is unknown, to me as to everyone else.
Used this way, the figures give you background for your decision.
They sit beside what you want from a home, how you want to live in it and when. Those are the questions that decide whether a particular home is right for you.
Those are the questions that decide whether a particular home is right for you.
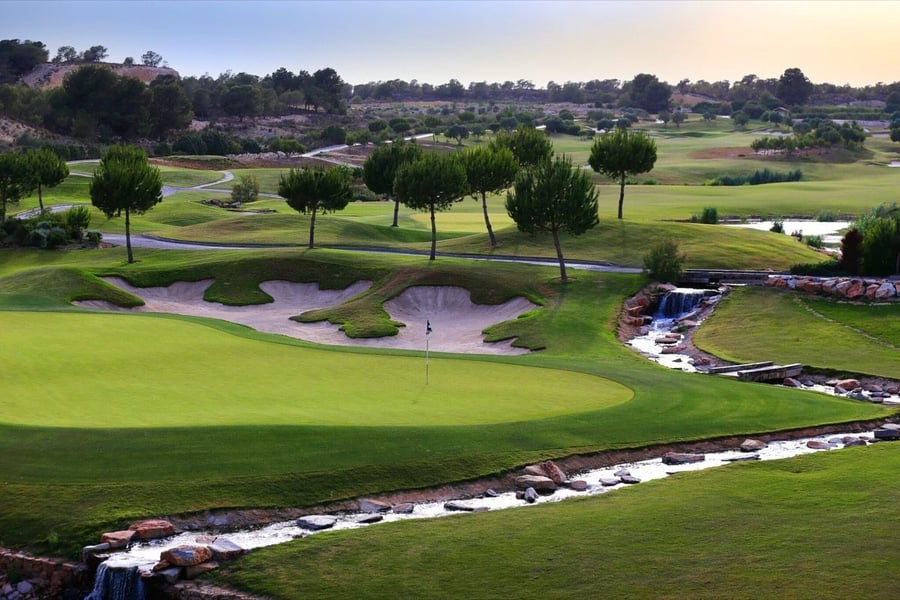
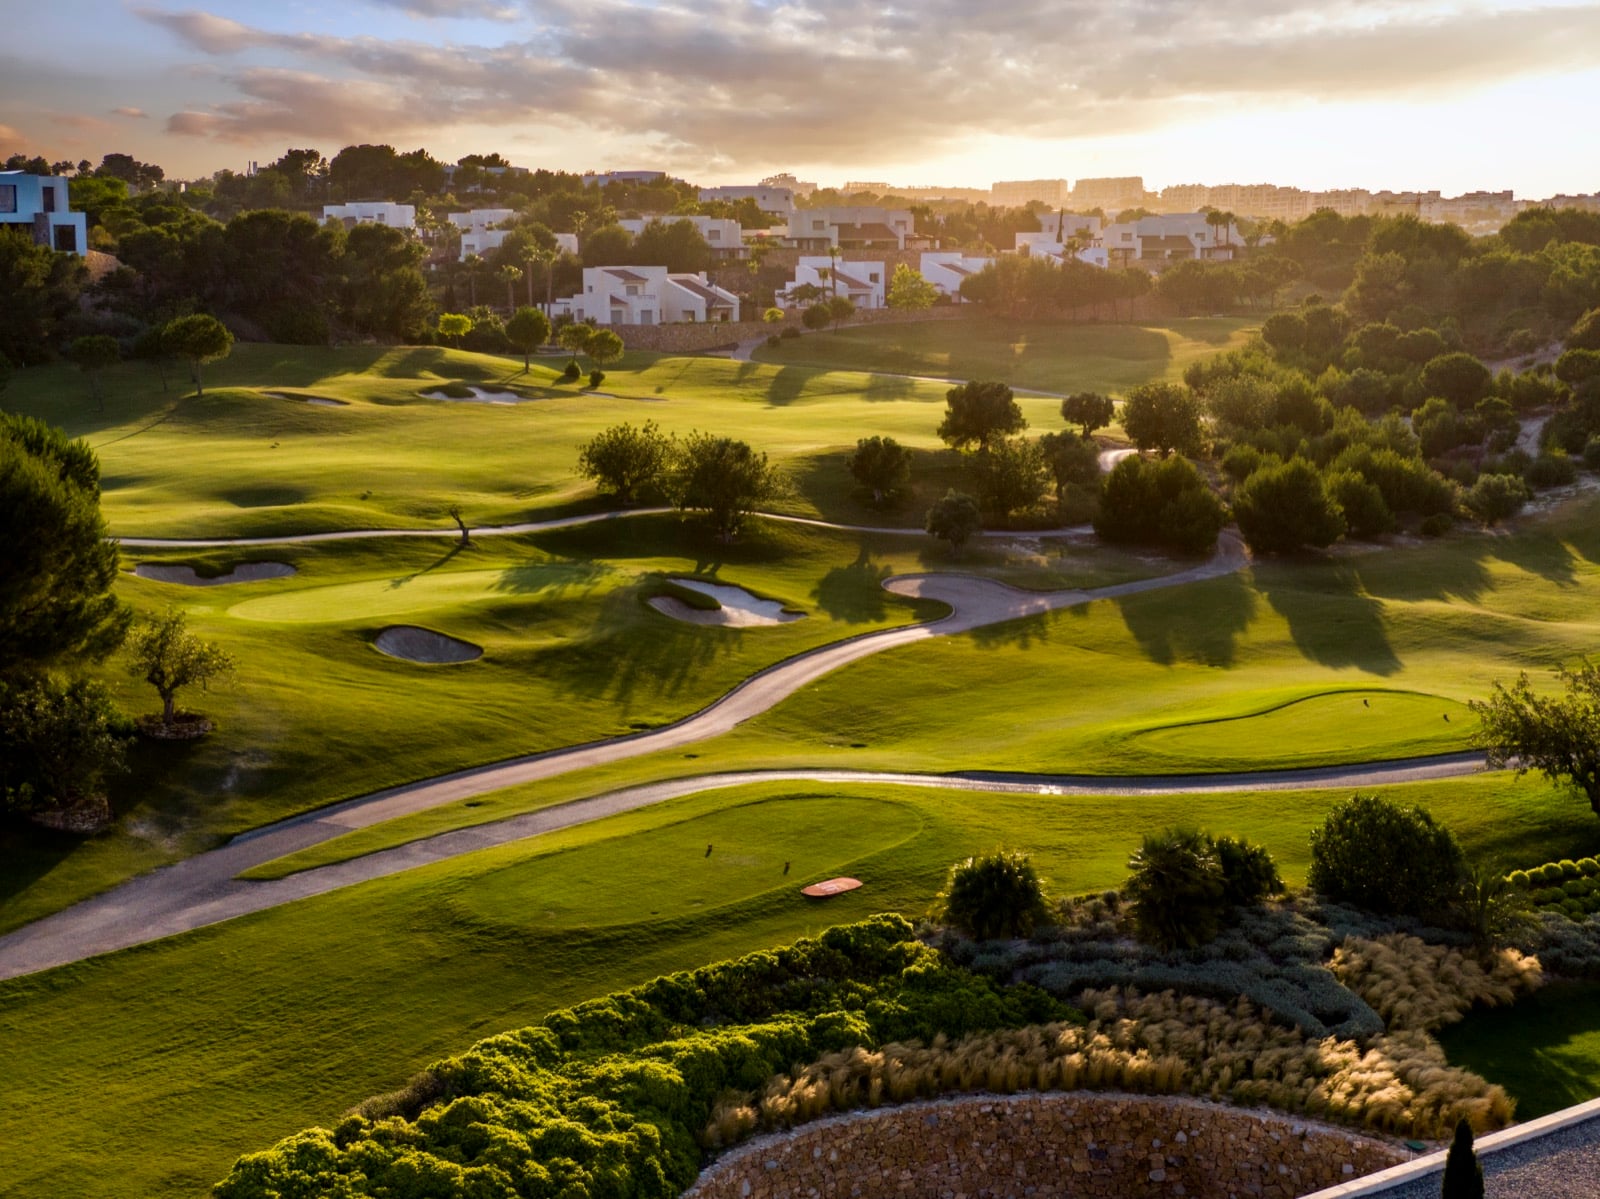
Evening light over the course
If you would like to talk through what the figures mean for a home you have in mind, you are welcome to begin the conversation. I am happy to look at it with you.
Sources: Tinsa, IMIE Mercados Locales, third quarter 2026 report, table of provinces, page 18 (Alicante / Alacant, year-on-year change in value per square metre). European Commission, Spring 2026 Economic Forecast, Spain, 21 May 2026. This article is general information, not financial advice. Prices can move in either direction.